Visual Studio code
Web: https://code.visualstudio.com/.
23/5/2026 UpdateModule ceuadmin/VSCode/1.121.0 is available.
Module ceuadmin/VSCode/1.104.0 is available.
Module ceuadmin/VSCode/1.100.2 replaces earlier version.
Installation
This is downloaded directly using CLI.
cd $CEUADMIN/VSCode || exit 1
export url=https://update.code.visualstudio.com/api/update/linux-x64/stable/latest
export version=$(curl -s $url | jq -r '.productVersion')
wget -qO- https://update.code.visualstudio.com/latest/linux-x64/stable | tar -xzf -
mv VSCode-linux-x64 "$version"
cd "$version"
./code --no-sandbox
which replaces earlier effort to download and extract a copy for Linux x64, e.g., version 1.58.0,
cd ${HPC_WORK}
tar xvfz code-stable-x64-1625728370.tar.gz
ln -sf ${HPC_WORK}/VSCode-linux-x64/bin/code ${HPC_WORK}/bin/code
By default it requires chrome-sandbox is owned by root and has mode 4755 which could be achieved at CSD3 by
sudo chown root:root chrome-sandbox
sudo chmod 4755 chrome-sandbox
Unfortunately, as ordinary users this is impossible and we use without this option.
Execution
Start for reasons above,
code --no-sandbox
ceuadmin module
This is called with
module load ceuadmin/VSCode/1.100.2
which enables executation with relevant command-line arguments.
Extensions are in the ~/.vscode directory, while user settings can be traced from ~/.config/Code/User/settings.json.
In fact, it is easier to make a customised Python virtual environment visible through evironmental variables, e.g.,
export PATH=~/rds/software/py3.11/bin:$PATH
export PYTHONPATH=~/rds/software/py3.11/lib/python3.9/site-packages
code &
Jupyter notebook
We could start our virtual environment as described in hail, e.g.,
cd ~/rds/results/public/gwas/ukb_exomes/tutorials
code --no-sandbox 01-genome-wide-association-study.ipynb &
which greatly simplifies the procedure as described for genebass. MAKE sure various extensions/options suggesed from the session.
Markdown document
The short cut key for preview is Ctrl-Shift-V, but will be automatically enabled by changing settings.json,
"workbench.editorAssociations": { "*.md": "vscode.markdown.preview.editor" }
A Markdown All in One extension is also an option.
HTML preview
Again this is possible with extensions.
CodeGPT
From Visual Studio Code, install CodeGPT.
Supply an API key from Open AI, https://platform.openai.com/overview, entered via Ctrl-Shift-p for CodeGPT: Set API Key.
Create a file such as testCodeGPT.R with comments # I would like to draw a forest plot and key in Ctrl-Shift-i.
Here is an example,
# Can I draw a Manhattan plot of GWAS
with answer below,
Yes, you can draw a Manhattan plot of GWAS in R using the qqman package.
Here's a sample code:
# install and load the `qqman` package
install.packages("qqman")
library(qqman)

# read in the GWAS results file
gwas_results <- read.table("my_gwas_results.txt", header=T)

# specify the chromosome column
chr_col <- "CHR"

# specify the p-value column
pval_col <- "P_VALUE"

# draw the Manhattan plot
manhattan(gwas_results, chr=chr_col, p=pval_col)
Replace "my_gwas_results.txt" with the actual name of your GWAS results file. Also, make sure to specify the correct column names for chromosome and p-value in chr_col and pval_col, respectively.
Bash IDE
The named extension requires both ShellCheck and bash-language-server to be enabled.
To integrate with VS Code, we have "Preference: Open Settings (JSON)" (Ctrl +, ) as follows,
{
    "jupyter.askForKernelRestart": false,
    "git.openRepositoryInParentFolders": "never",
    "notebook.lineNumbers": "on",
    "python.terminal.activateEnvInCurrentTerminal": true,
    "security.workspace.trust.untrustedFiles": "open",
    "workbench.editorAssociations": {
        "*.md": "vscode.markdown.preview.editor"
    },

    "bashIde.enableSourceErrorDiagnostics": true,
    "bashIde.shellcheckPath": "/usr/local/Cluster-Apps/ceuadmin/shellcheck/0.11.0/shellcheck",
    "bashIde.shellcheckArguments": ["-x"]
}
A screenshot is given here, 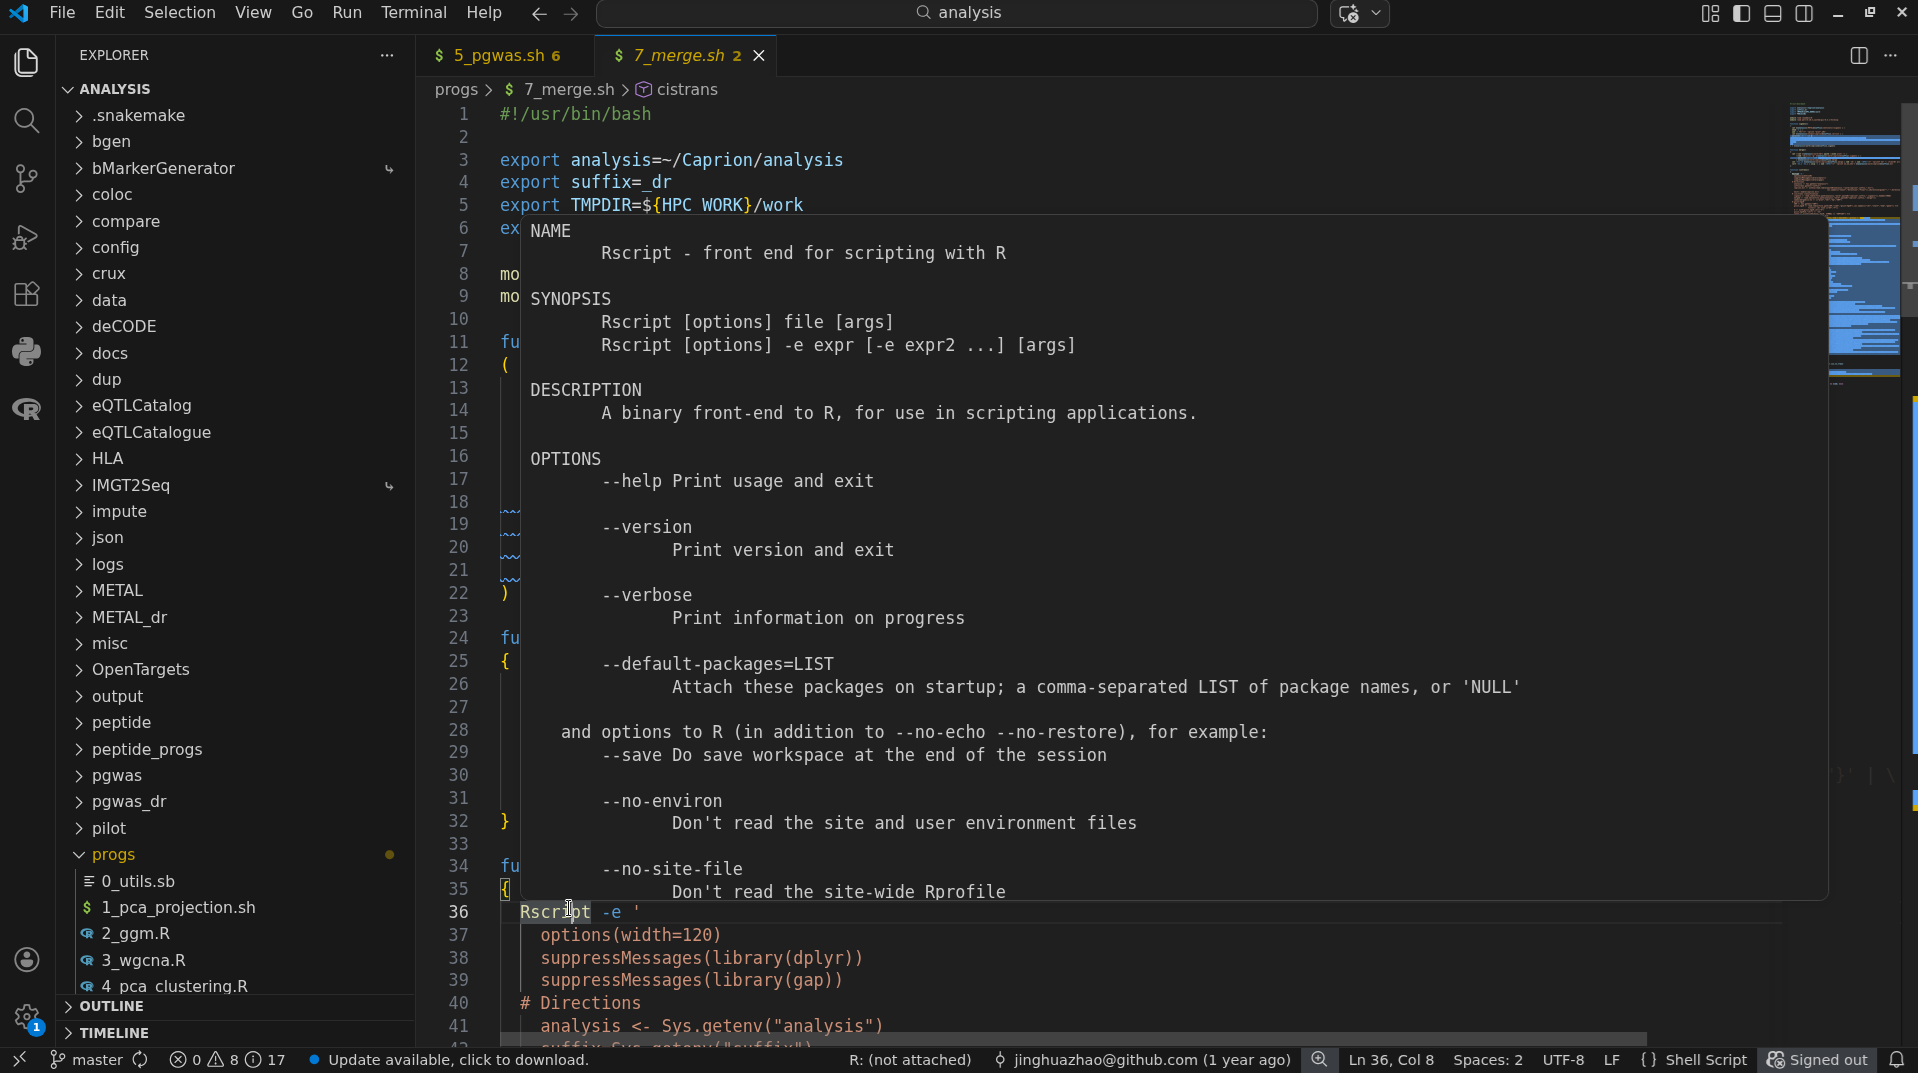
Zed
Web, https://zed.dev/
This is one of the competitors, noted for flatpak:
#!/bin/bash
# Custom Flatpak Zed installer for CentOS 8 / RHEL 8 without root

# 1️⃣ Set custom install directory
export FLATPAK_USER_DIR="$CEUADMIN/zed/0.215.3"
export FLATPAK_USER_DIR="/rds/project/rds-4o5vpvAowP0/software/zed/0.215.3"
mkdir -p "$FLATPAK_USER_DIR"
export XDG_DATA_HOME="$FLATPAK_USER_DIR"

# 2️⃣ Add Flathub remote if missing
flatpak --user remote-add --if-not-exists flathub https://flathub.org/repo/flathub.flatpakrepo

# 3️⃣ Install Zed
flatpak install --user -y flathub dev.zed.Zed

# 4️⃣ Run Zed to verify
flatpak run --user dev.zed.Zed

# 5️⃣ Optional: create a desktop launcher
mkdir -p "$HOME/.local/share/applications"
cat > "$HOME/.local/share/applications/zed.desktop" <<EOL
[Desktop Entry]
Name=Zed Editor
Exec=flatpak run --user dev.zed.Zed
Terminal=false
Type=Application
Icon=zed
Categories=Development;IDE;
EOL

echo "✅ Zed installed in $FLATPAK_USER_DIR and desktop launcher created."